Examples
You can invoke Dublin-traceroute in multiple ways. So far there are:
- a command-line tool,
dublin-traceroute, - a C++ library,
libdublintraceroute.so, - a Python module,
dublintraceroute, which now lives in a separate repository, see python-dublin-traceroute.
Using the command-line tool
NOTE: the CLI tool is still in development and lacks many features.
The basic usage of dublin-traceroute is the following:
$ dublin-traceroute <target>
For example, you can traceroute Google’s public DNS server as follows:
$ dublin-traceroute 8.8.8.8
The current default is to probe 20 different paths with a maximum TTL set to 30.
You will see the output on the terminal, but dublin-traceroute will also
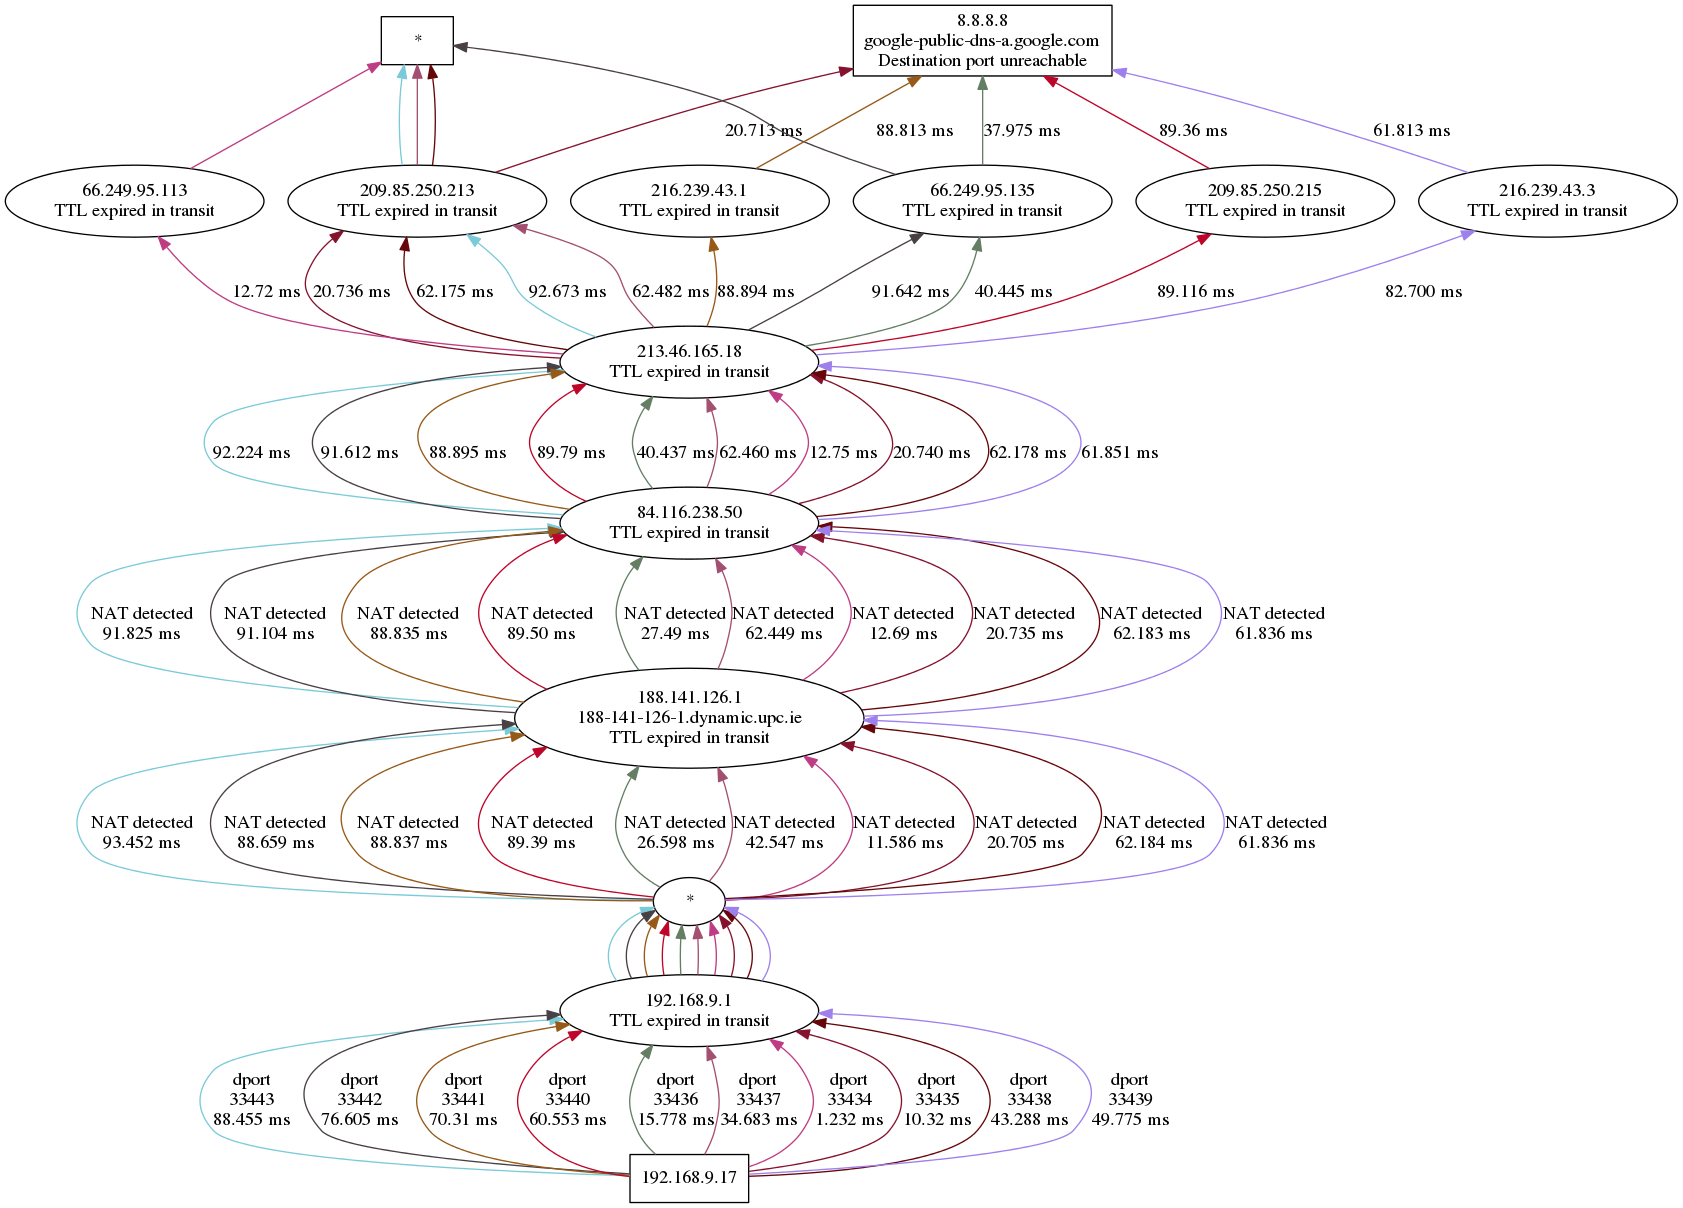
create a file named trace.json in the current directory. You can run the
script located at scripts/to_graphviz.py to generate an image showing graphically
the traceroute. The image file is named trace.json.png. For example:
$ dublin-traceroute 8.8.8.8
... <output of the traceroute>
$ python scripts/to_graphviz.py trace.json
$ eog trace.json.png # or open it with your favourite viewer
The image will look something like this:
You can view the content of trace.json of course, and use it as needed.
Using Python
The Python bindings have been split into a separate package. See python-dublin-traceroute .
Using the C++ library
TODO
Meanwhile, you can look at the implementation of the command-line tool